画像とNumPy配列
画像を NumPy 配列として扱う基礎を確認する.
import urllib.request

import matplotlib.pyplot as plt
import numpy as np
01-01. 画像とビットマップ画像
ビットマップ画像 (bitmap image)は,格子状に並んだ画素 (pixel)に値を割り当てて表現する. そのためPythonでは画像をNumPy配列として扱うことが多い.
# 小さな「画像」(2次元配列)を作って表示する
small = np.array(
    [
        [0, 0, 1, 0, 0],
        [0, 1, 1, 1, 0],
        [1, 1, 1, 1, 1],
        [0, 1, 1, 1, 0],
        [0, 0, 1, 0, 0],
    ]
)
plt.imshow(small, cmap="gray")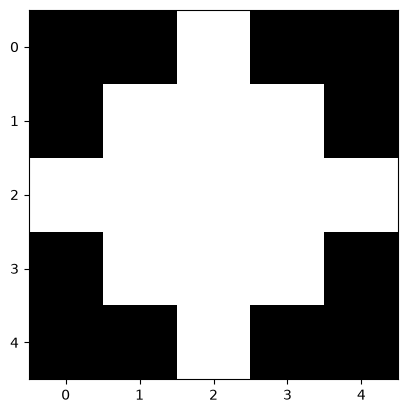
各マスが1画素であり,値が明るさに対応する.
01-02. 画像の読み込みと表示
実際の画像を読み込む.ここではトケイソウ属(Passiflora)の葉のスキャン画像を使う.
# R2 上の画像を取得して読み込む
base = "https://assets.ku-compbio.noshita.net/2026/P2-04/images/"
filename = "Pedu1_1_4.png"
urllib.request.urlretrieve(base + filename, filename)

img = plt.imread(filename)
plt.imshow(img)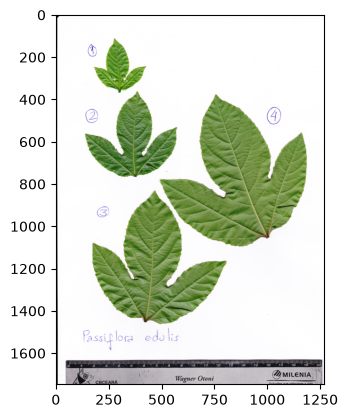
読み込んだ画像も NumPy 配列である.形(shape)と型(dtype)を見てみよう.
img.shape, img.dtype((1748, 1268, 3), dtype('float32'))カラー画像では(縦, 横, チャネル) の3次元配列になる.
スライスで一部の葉を切り出して拡大できる.
# 1枚の葉を切り出す(縦 380:1100, 横 490:1190)
plt.imshow(img[380:1100, 490:1190])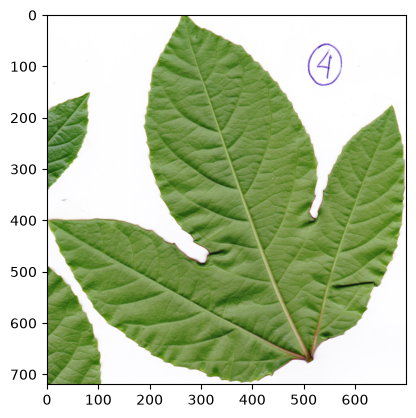
01-03. カラー画像のデータ構造
カラー画像は R・G・B の3チャネルをもつ.葉の内部にある画素の値を直接見てみよう.
# 葉の内部にある 3×3 画素の値
img[700:703, 800:803]
array([[[0.46666667, 0.5921569 , 0.3137255 ],
[0.45882353, 0.57254905, 0.27058825],
[0.47843137, 0.5921569 , 0.2784314 ]],
[[0.48235294, 0.6 , 0.33333334],
[0.49019608, 0.6039216 , 0.34117648],
[0.47843137, 0.59607846, 0.32156864]],
[[0.5019608 , 0.6 , 0.34509805],
[0.5254902 , 0.6156863 , 0.36862746],
[0.5176471 , 0.6117647 , 0.35686275]]], dtype=float32)各画素が [R, G, B] の3値をもつ.チャネルごとに分解して表示する.
fig, axes = plt.subplots(1, 3, figsize=(12, 4))
for ax, c, name in zip(axes, range(3), ["Red", "Green", "Blue"]):
    ax.imshow(img[:, :, c], cmap="gray")
    ax.set_title(name)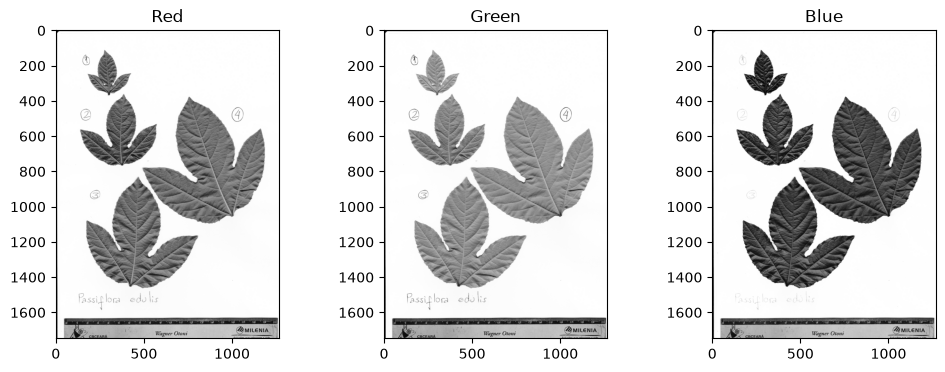
葉は緑チャネルで明るく写る.この性質は後で葉だけを取り出すのに使う.
01-04. グレイスケール
グレイスケール (grayscale)画像は明るさ1値のみをもつ.RGB の加重和で変換する.
img_gray = img[:, :, :3] @ [0.2989, 0.587, 0.114]
img_gray.shape
(1748, 1268)縦・横の2次元配列になった.
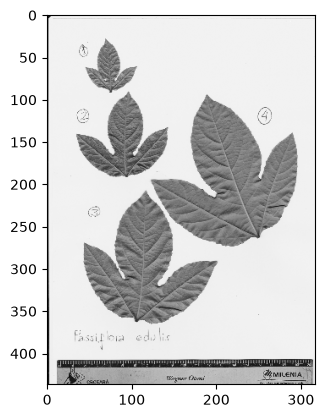
plt.imshow(img_gray, cmap="gray")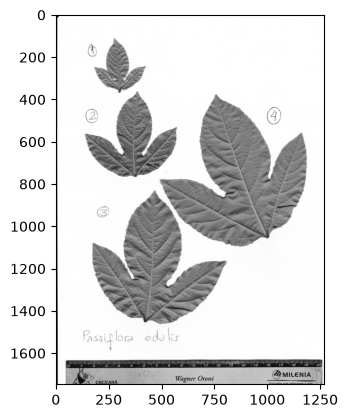
Solution to Exercise 1
from scipy import ndimage as ndi

img_small = ndi.zoom(img_gray, 0.25)
print(img_gray.shape, "->", img_small.shape)
plt.imshow(img_small, cmap="gray")
(1748, 1268) -> (437, 317)