02 待ち時間,ランダムウォーク,ライト-フィッシャー モデル
サイコロの目の総和が100を超えるまでの待ち時間
# 02-01. サイコロの目の総和が100を超えるまでの待ち時間
import random

x = 0
for i in range(100):
    r = random.randrange(1, 7)
    x = x + r
    print(f"{i + 1}回目:", x)
    if x >= 100:
        print(f"{i + 1}回目で100を超えた.")
        break
1回目: 6
2回目: 11
3回目: 17
4回目: 23
5回目: 28
6回目: 33
7回目: 37
8回目: 39
9回目: 42
10回目: 45
11回目: 49
12回目: 54
13回目: 60
14回目: 65
15回目: 66
16回目: 72
17回目: 74
18回目: 80
19回目: 81
20回目: 85
21回目: 88
22回目: 92
23回目: 97
24回目: 101
24回目で100を超えた.
ランダムウォーク
1 次元単純ランダムウォーク (random walk)をシミュレーションする.
# 02-02a. ランダムウォーク choice
x = 0
x_list = [x]
for i in range(100):
    r = random.choice([-1, 1])
    x = x + r
    x_list.append(x)
import matplotlib.pyplot as plt
plt.plot(x_list)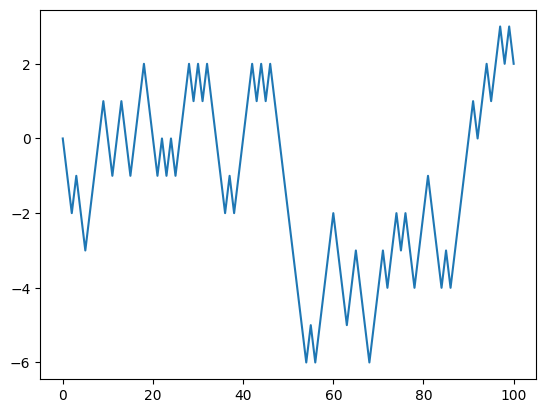
# 02-02b. ランダムウォーク randrange
x = 0
x_list = [x]
for i in range(100):
    r = random.randrange(-1, 2, 2)
    x = x + r
    x_list.append(x)

plt.plot(x_list)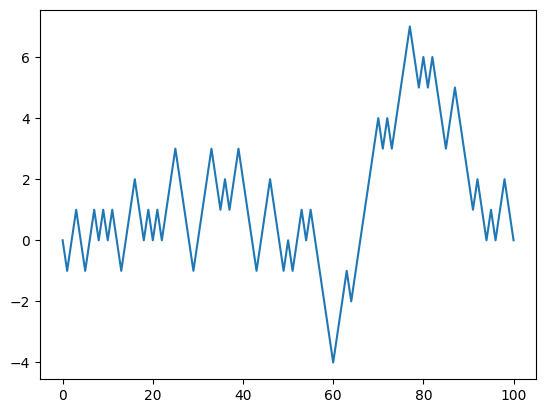
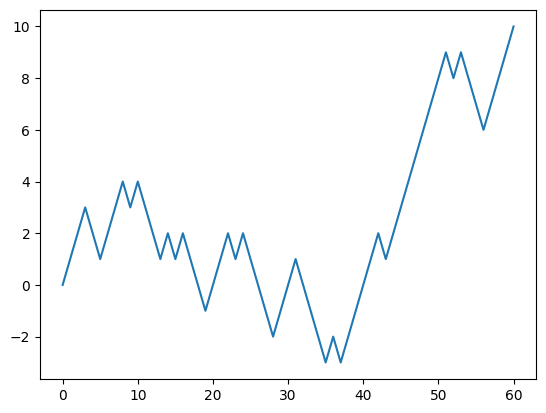
ランダムウォークの待ち時間 (waiting time)
# 02-03. ランダムウォークの待ち時間
x = 0
x_list = [x]
for i in range(10000):
    r = random.choice([-1, 1])
    x = x + r
    x_list.append(x)
    if x >= 10:
        break
print("待ち時間:", len(x_list) - 1)
plt.plot(x_list)
待ち時間: 60
ライト-フィッシャー モデル
ライト-フィッシャー モデル (Wright-Fisher model)では,集団サイズ を一定とし,次世代の各個体は前世代から一様ランダムに親を選んで遺伝子を引き継ぐ.これにより遺伝的浮動 (genetic drift)が生じる.
# 02-04. ライト-フィッシャー モデル
pop_size = 100  # 個体数
gen_end = 200  # 最終世代

# aの初期値の設定
a = []
for i in range(pop_size):
    if i % 2 == 0:
        a.append(0)
    else:
        a.append(1)

a_list = [a.copy()]

for t in range(gen_end):
    # a_newの初期化
    a_new = []

    for i in range(pop_size):
        p1 = random.randrange(pop_size)
        p2 = random.randrange(pop_size)
        r = random.choice([a[p1], a[p2]])
        a_new.append(r)

    a = a_new.copy()
    a_list.append(a.copy())

# 結果の表示
for a in a_list:
    print(a)
Fetching long content....
ライト-フィッシャー モデルの結果の可視化
# 02-05. matshowによる可視化
plt.matshow(a_list, interpolation=None, vmin=0, vmax=1)
plt.ylabel("generation")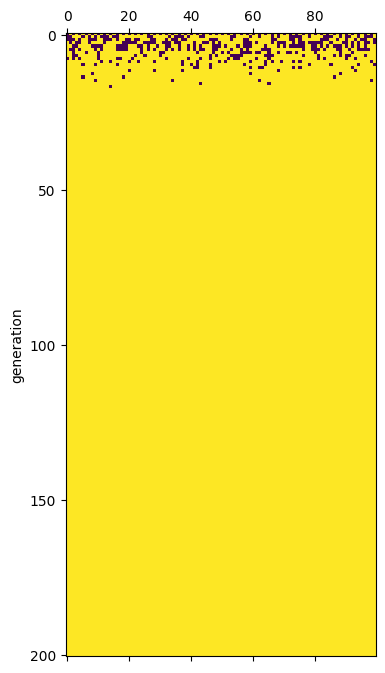
# 02-06. 頻度の世代を経た変化
p_list = []
q_list = []
for a in a_list:
    p = sum(a) / len(a)
    p_list.append(p)
    q_list.append(1 - p)

plt.plot(p_list, "-", q_list, "-")
plt.legend(["p", "q"])
plt.xlabel("generation")
plt.ylabel("Frequency")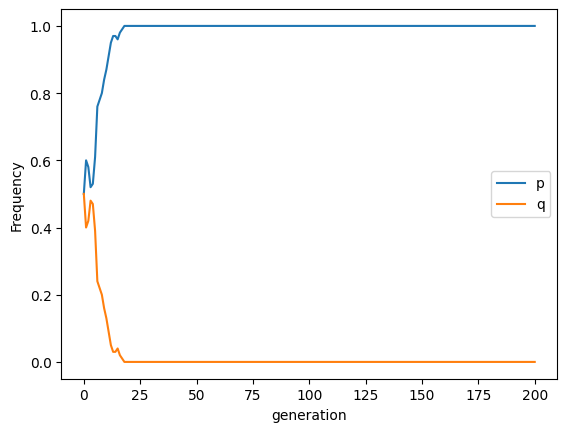
リストのコピー
Python の代入はオブジェクトの複製ではなくラベル付けに過ぎないため,ネストされたリストを扱うと意図しない共有が起こる.
問題にならないケース
# 問題にならないケース
a_list = []
for i in range(10):
    a = [i, i, i]
    a_list.append(a)

print(a_list)
[[0, 0, 0], [1, 1, 1], [2, 2, 2], [3, 3, 3], [4, 4, 4], [5, 5, 5], [6, 6, 6], [7, 7, 7], [8, 8, 8], [9, 9, 9]]
問題になるケース
# 問題になるケース
a_list = []
a = [0, 0, 0]
for i in range(10):
    for j in range(3):
        a[j] = i
    a_list.append(a)

print(a_list)
[[9, 9, 9], [9, 9, 9], [9, 9, 9], [9, 9, 9], [9, 9, 9], [9, 9, 9], [9, 9, 9], [9, 9, 9], [9, 9, 9], [9, 9, 9]]
修正
浅いコピー (shallow copy)を返す list.copy() を使い,各世代のリストを独立した要素として保存する.
# 修正
a_list = []
a = [0, 0, 0]
for i in range(10):
    for j in range(3):
        a[j] = i
    a_list.append(a.copy())

print(a_list)
[[0, 0, 0], [1, 1, 1], [2, 2, 2], [3, 3, 3], [4, 4, 4], [5, 5, 5], [6, 6, 6], [7, 7, 7], [8, 8, 8], [9, 9, 9]]
突然変異の固定 (fixation of mutation)までの待ち時間
# 02-07. 突然変異固定までの平均待ち時間を10回分について計算してみようSolution to Exercise 1
例は以下の通り.
# 02-07. 突然変異固定までの平均待ち時間
num_trials = 10
pop_size = 100
init_num_target = int(pop_size / 2)

waiting_time = []
for n in range(1000):
    a = []
    for i in range(pop_size):
        if i < init_num_target:
            a.append(0)
        else:
            a.append(1)

    a_list = [a.copy()]
    for t in range(100000):
        a_new = []

        for i in range(pop_size):
            p1 = random.randrange(pop_size)
            p2 = random.randrange(pop_size)
            r = random.choice([a[p1], a[p2]])
            a_new.append(r)

        a = a_new.copy()
        a_list.append(a.copy())
        if sum(a) == 0 or sum(a) == pop_size:
            break

    if sum(a_list[-1]) == 0 or sum(a_list[-1]) == pop_size:
        waiting_time.append(len(a_list))
    if len(waiting_time) >= num_trials:
        break

# 平均待ち時間
sum(waiting_time) / len(waiting_time)154.2関数を使うと見通しが良くなる.別の例は以下の通り.
def wright_fisher_model(pop_size, gen_end, init_num_target, extinct_break=False):
    """Wright-Fisher model

    ハプロタイプを仮定したライト-フィッシャーモデルに基づく遺伝的浮動.

    Args:
        pop_size: 集団サイズ
        gen_end: 最終世代
        init_num_target: 注目している遺伝子型の初期数
        extinct_break: どちらかの遺伝子型が絶滅した場合に処理を中断するか

    Returns:
        a_list: 各世代の遺伝子型を記録したリスト

    """
    if pop_size < init_num_target:
        print(
            "注目する遺伝子型の初期値`init_num_target`は集団サイズ`pop_size`以下でなければならない."
        )
        return

    a = []

    for i in range(pop_size):
        if i < init_num_target:
            a.append(0)
        else:
            a.append(1)

    a_list = [a.copy()]
    for t in range(gen_end):
        a_new = []
        for i in range(pop_size):
            p1 = random.randrange(pop_size)
            p2 = random.randrange(pop_size)
            r = random.choice([a[p1], a[p2]])
            a_new.append(r)
        a = a_new.copy()
        a_list.append(a.copy())

        if ((sum(a) == pop_size) or (sum(a) == 0)) and extinct_break:
            break

    return a_list
# 待ち時間
num_trials = 10
pop_size = 100
init_num_target = int(pop_size / 2)
waiting_time = []
for n in range(1000):
a_list = wright_fisher_model(pop_size, 100000, init_num_target, extinct_break=True)
if sum(a_list[-1]) == 0 or sum(a_list[-1]) == pop_size:
waiting_time.append(len(a_list))
if len(waiting_time) >= num_trials:
break# 平均待ち時間
sum(waiting_time) / len(waiting_time)101.8突然変異固定までの平均待ち時間の解析解
半数体集団における中立な対立遺伝子の突然変異の固定 (fixation of mutation)までの平均待ち時間は,拡散近似のもとで初期頻度 の関数として次のように与えられる(Kimura & Ohta 1969).
初期頻度 が小さいほど は大きくなり,また集団サイズ に比例して長くなる.
Solution to Exercise 2
例は以下の通り.math.log を用いるため math モジュールをインポートする. では 0 除算, では が発散するため,両端を除いた範囲で評価する.
# 解析解 T(p) のプロット
import math


def analytical_waiting_time(p, pop_size):
    """半数体集団における突然変異固定までの平均待ち時間の解析解."""
    t = -(1 / p) * (2 * pop_size * (1 - p) * math.log(1 - p))
    return t


p_list = []
t_100_list = []
t_200_list = []
for i in range(1, 100):
    p = 0.01 * i
    p_list.append(p)
    t_100_list.append(analytical_waiting_time(p, 100))
    t_200_list.append(analytical_waiting_time(p, 200))

plt.plot(p_list, t_100_list, "-", label="N = 100")
plt.plot(p_list, t_200_list, "-", label="N = 200")
plt.xlabel("Initial frequency p")
plt.ylabel("Waiting time T(p)")
plt.legend()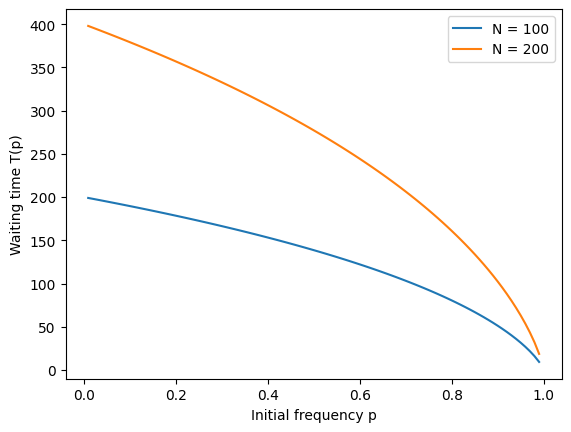
- Kimura, M., & Ohta, T. (1969). THE AVERAGE NUMBER OF GENERATIONS UNTIL FIXATION OF A MUTANT GENE IN A FINITE POPULATION. Genetics, 61(3), 763–771. 10.1093/genetics/61.3.763