03 Matplotlibによる可視化
可視化 (visualization)は計算結果をグラフにして確認する作業で,Python では Matplotlib が標準的に使われる.
plt.plot で折れ線を描く
Matplotlib の pyplot モジュールを plt として,math も併せて読み込む.
# 03-01. plot関数

import matplotlib.pyplot as plt
import math
plt.plot は,「x座標のリスト」と「y座標のリスト」を受け取り,対応する点を結ぶ折れ線を描く.
x_list = [0, math.pi / 2, math.pi, 3 * math.pi / 2, 2 * math.pi]
y_list = [0, 1, 0, -1, 0]
plt.plot(x_list, y_list)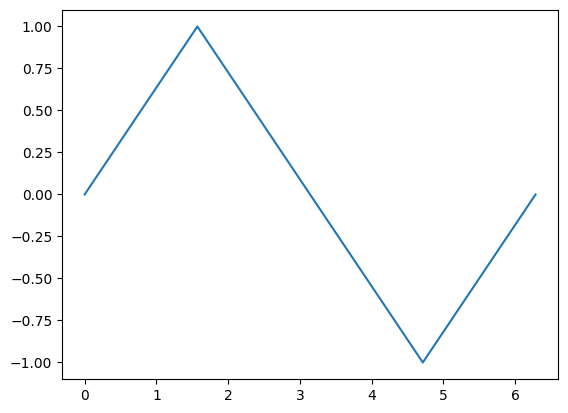
ループでデータを作って可視化する
for ループでデータを生成して点の数を増やし,なめらかな曲線を描く.
# 03-02. sin関数のプロット

x_start = 0
x_end = 2 * math.pi
step = math.pi / 36

i_start = 0
i_end = int((x_end - x_start) / step)

x_list = []
y_list = []
for i in range(i_start, i_end + 1):
    x = x_start + step * i
    y = math.sin(x)
    x_list.append(x)
    y_list.append(y)
plt.plot(x_list, y_list)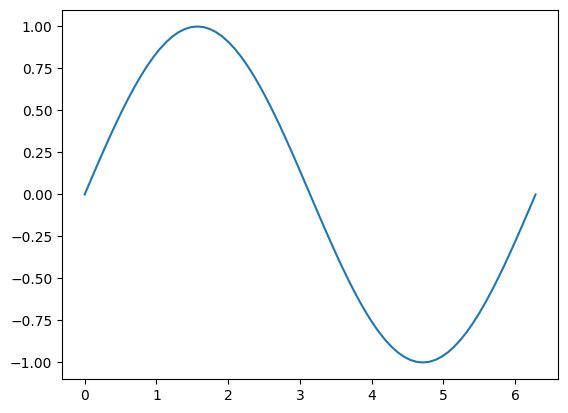
演習
Solution to Exercise 1
import math

import matplotlib.pyplot as plt

x_start = 0
x_end = 4 * math.pi
step = math.pi / 36

x_list = []
y_list = []
i_end = int((x_end - x_start) / step)
for i in range(i_end + 1):
    x = x_start + step * i
    x_list.append(x)
    y_list.append(math.cos(x))

plt.plot(x_list, y_list)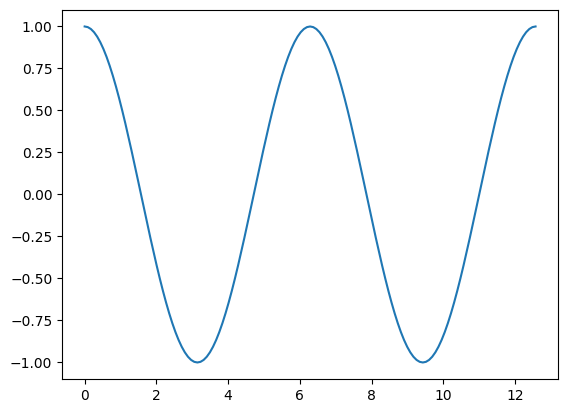
Solution to Exercise 2
import math

import matplotlib.pyplot as plt


def plot_sin(step):
    x_start = 0
    x_end = 2 * math.pi
    i_end = int((x_end - x_start) / step)
    x_list = []
    y_list = []
    for i in range(i_end + 1):
        x = x_start + step * i
        x_list.append(x)
        y_list.append(math.sin(x))
    plt.plot(x_list, y_list, marker="o")
plot_sin(math.pi / 2)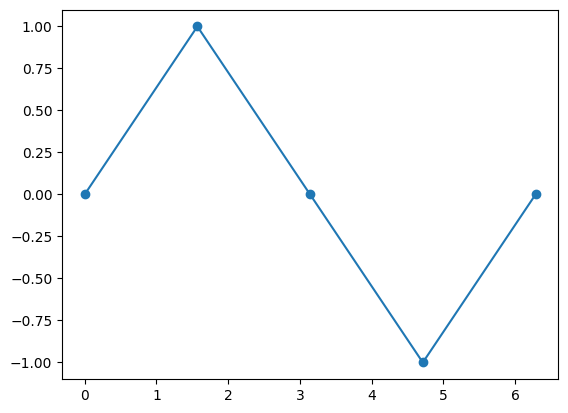
plot_sin(math.pi / 4)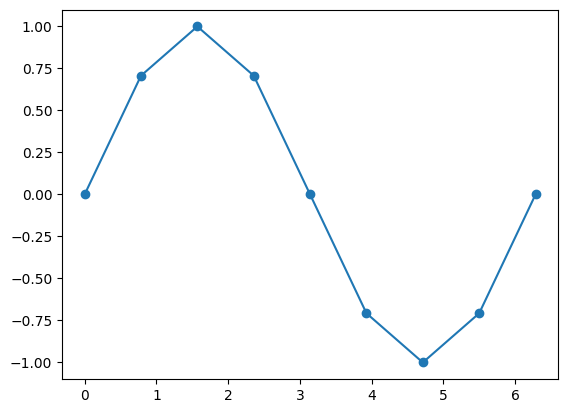
plot_sin(math.pi / 8)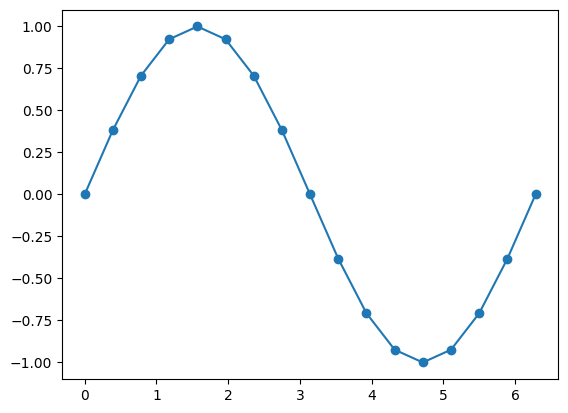
plot_sin(math.pi / 90)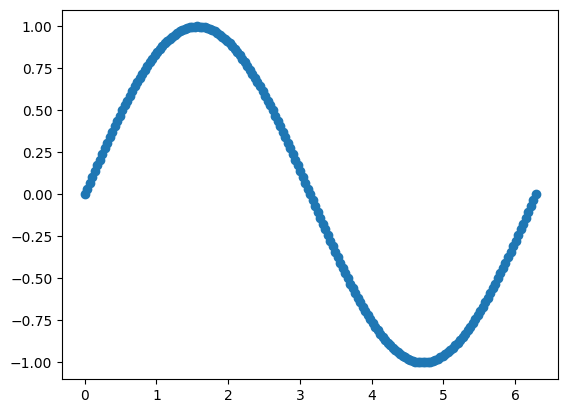
刻み幅が大きいと折れ線がガタガタになり,小さくするほどなめらかな曲線に見える.