04-02 指数増殖,ロジスティック成長モデル
解析解のプロット
02-01. 指数増殖
# 02-01. 指数増殖
import math

import matplotlib.pyplot as plt
a = 0.2
x0 = 10
dt = 0.1
t_list = []
x_list = []
for i in range(1001):
t = dt * i
x = x0 * math.exp(a * t)
t_list.append(t)
x_list.append(x)
plt.plot(t_list, x_list)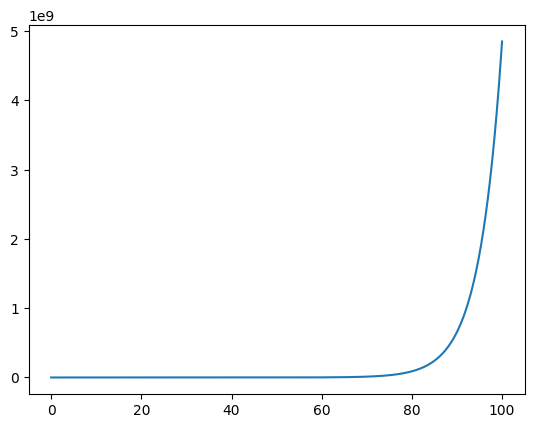
02-02. ロジスティック成長
指数増殖のプログラムを参考に自分で考えてみてください
微分方程式を数値的に解く
02-03. 指数増殖(数値解)
# 02-03. 指数増殖(数値解)
a = 0.2
x0 = 10

dt = 0.1

t = 0
x = x0
t_list = [t]
x_list = [x]
for i in range(1000):
    t = dt * (i + 1)
    x = x + a * x * dt

    t_list.append(t)
    x_list.append(x)
plt.plot(t_list, x_list)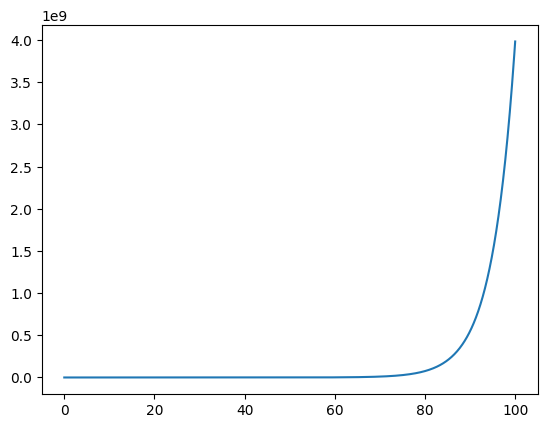
02-04. 指数増殖(解析解と数値解の比較)
# 02-04. 指数増殖(解析解と数値解の比較)
a = 0.2
x0 = 10
t_end = 100

dt_a = 0.1
i_end_a = int(t_end / dt_a)

dt_n = 0.1
i_end_n = int(t_end / dt_n)

# 解析解
x_list_a = []
t_list_a = []
for i in range(i_end_a):
    t = dt_a * i
    x = x0 * math.exp(a * t)
    t_list_a.append(t)
    x_list_a.append(x)

# 数値解
t = 0
x = x0
t_list_n = [t]
x_list_n = [x]
for i in range(i_end_n):
    t = dt_n * (i + 1)
    x = x + a * x * dt_n
    t_list_n.append(t)
    x_list_n.append(x)
# 可視化
plt.plot(t_list_a, x_list_a)
plt.plot(t_list_n, x_list_n)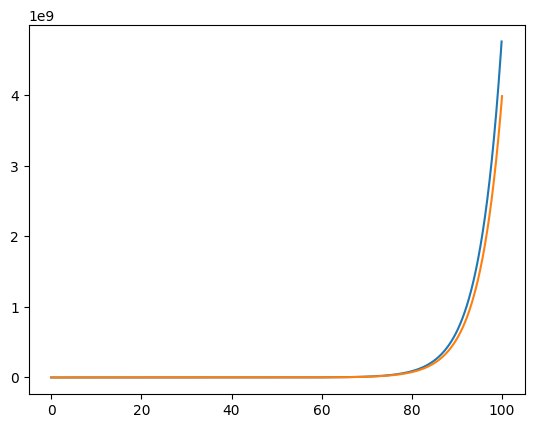
02-05. ロジスティック成長(数値解)
指数増殖のプログラムを参考に自分で考えてみてください