03-01 離散指数増殖モデルの数値計算とプロット
離散指数増殖モデルの数値計算とプロット
01-01. 離散指数増殖モデル(1)
# 01-01. 離散指数増殖モデル(1)
import matplotlib.pyplot as plt
a = 0.1
x = 1
t = 0
t_list = [t]
x_list = [x]
for i in range(100):
t = t + 1
x = x + a * x
t_list.append(t)
x_list.append(x)plt.plot(t_list, x_list)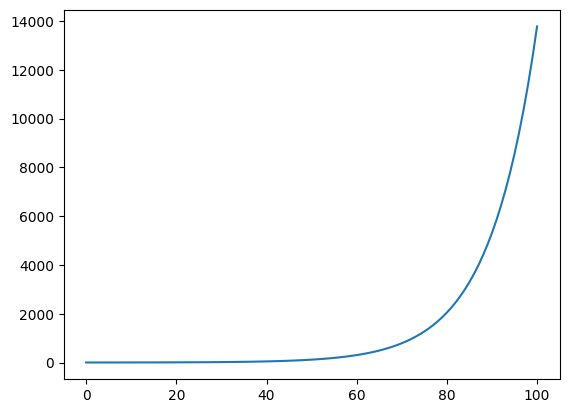
01-02. フォーマットの変更1
# 01-02. フォーマットの変更1
plt.plot(t_list, x_list, "ro")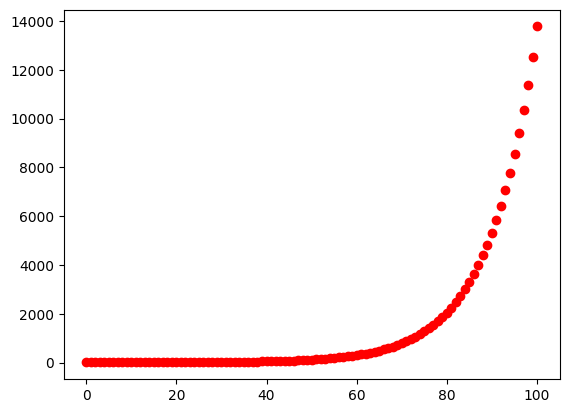
01-03. フォーマットの変更2
# 01-03. フォーマットの変更2
plt.plot(t_list, x_list, "k--")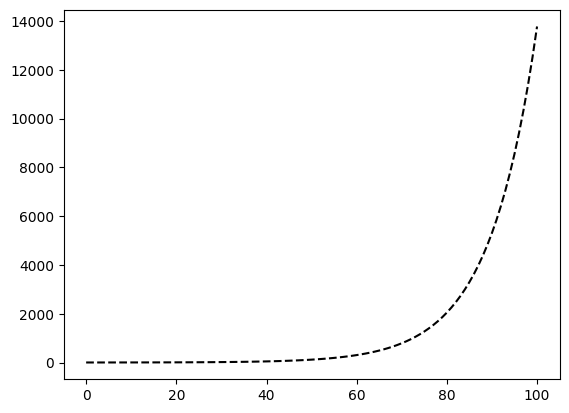
01-05. 複数のデータのプロット2
# 01-05. 複数のデータのプロット2
x_list_list = []
for a in [0.1, 0.11, 0.12]:
x = 1
t = 0
t_list = [t]
x_list = [x]
for i in range(100):
t = t + 1
x = x + a * x
t_list.append(t)
x_list.append(x)
x_list_list.append(x_list)plt.plot(t_list, x_list_list[0], t_list, x_list_list[1], t_list, x_list_list[2])
01-06. タイトル・軸ラベル1
# 01-06. タイトル・軸ラベル1
plt.plot(t_list, x_list)
plt.title("Exponential growth")
plt.xlabel("Time (t)")
plt.ylabel("Pop. size (x)")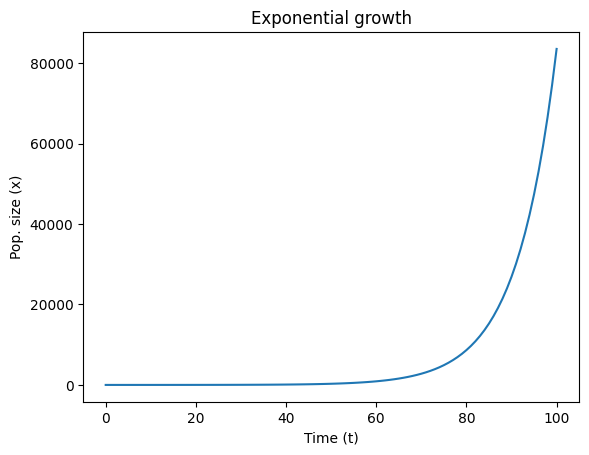
01-07. タイトル・軸ラベル2
# 01-07. タイトル・軸ラベル2
plt.plot(t_list, x_list)
plt.title("Exponential growth", fontsize="xx-large")
plt.xlabel("Time (t)", fontsize="x-large")
plt.ylabel("Pop. size (x)", fontsize="x-large")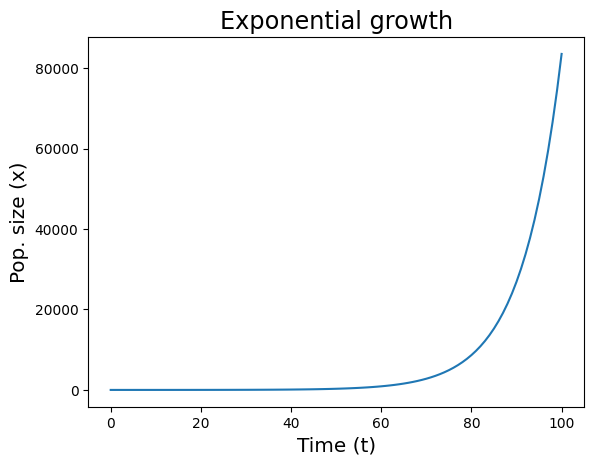
01-08. 解像度の変更
# 01-08. 解像度の変更
plt.figure(dpi=200)
plt.plot(t_list, x_list)
01-09. プロットサイズの変更
# 01-09. プロットサイズの変更
plt.figure(figsize=[5, 7])
plt.plot(t_list, x_list)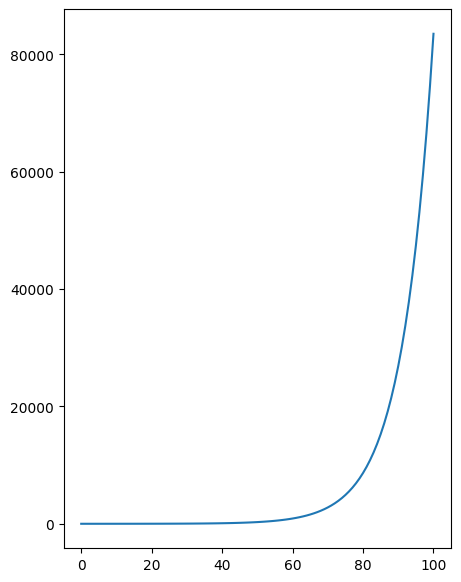
離散指数増殖モデル
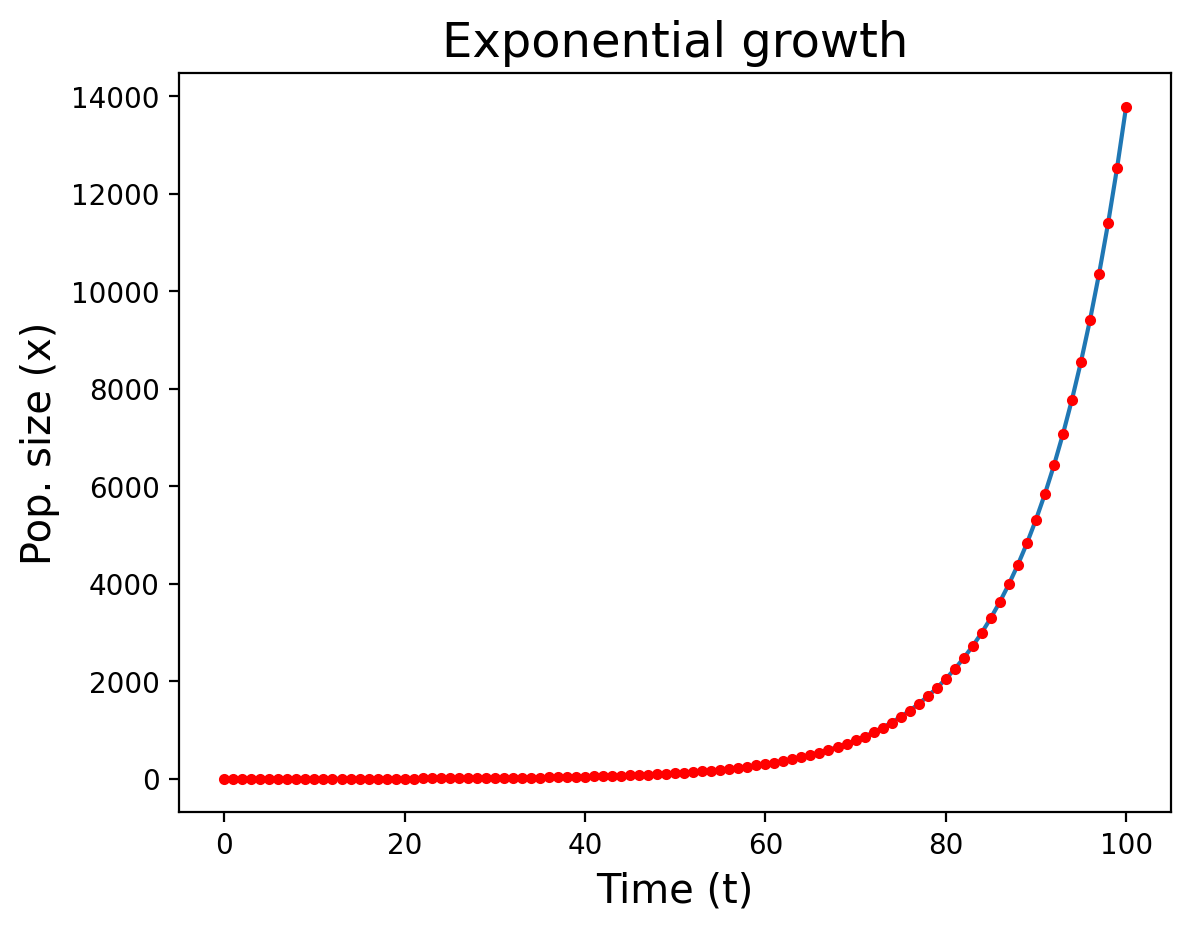
01-10. 離散指数増殖モデル(2)
# 01-10. 離散指数増殖モデル(2)
a = 0.1
x = 1
t = 0

t_list = [t]
x_list = [x]
for i in range(100):
    t = t + 1
    x = x + a * x

    t_list.append(t)
x_list.append(x)plt.figure(dpi=200)
plt.plot(t_list, x_list, "-", t_list, x_list, "r.")
plt.title("Exponential growth", fontsize="xx-large")
plt.xlabel("Time (t)", fontsize="x-large")
plt.ylabel("Pop. size (x)", fontsize="x-large")