02-03. 可視化
03-01. plot関数
# 03-01. plot関数
import matplotlib.pyplot as plt
import math
x_list = [0, math.pi/2, math.pi, 3*math.pi/2, 2*math.pi]
y_list = [0, 1, 0, -1, 0]plt.plot(x_list, y_list)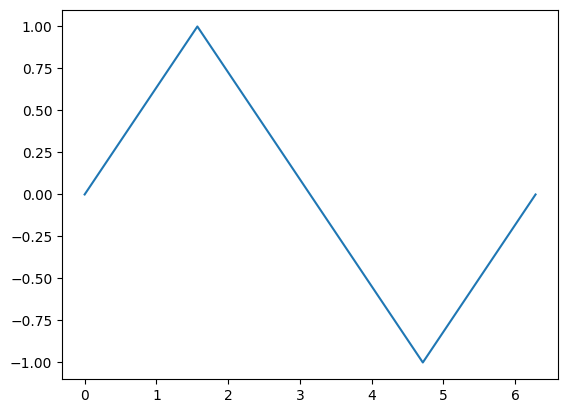
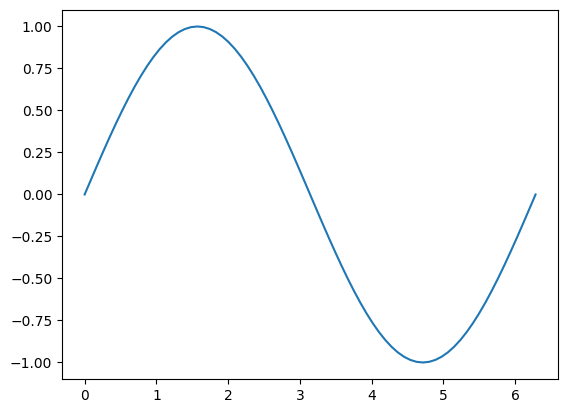
03-02. sin関数のプロット
# 03-02. sin関数のプロット

x_start = 0
x_end = 2 * math.pi
step = math.pi / 36

i_start = 0
i_end = int((x_end - x_start) / step)

x_list = []
y_list = []
for i in range(i_start, i_end + 1):
    x = x_start + step * i
    y = math.sin(x)
    x_list.append(x)
    y_list.append(y)
plt.plot(x_list, y_list)